

Diagram at a glance
Use a Diagram slide any time you need to show relationships, processes, data, or structure rather than a list of words or a poll result. The slide supports seven diagram types:
- Process flows and network diagrams — show how steps or systems connect.
- Org charts and decision trees — build hierarchies with nested levels.
- Bar, column, line, pie, and donut charts — display labelled numerical data.
- Timelines, roadmaps, and pyramids — lay out sequential or layered items.
- Comparisons — SWOT analyses, quadrants, binary comparisons.
- Word clouds — visualise terms sized by weight.
- Custom infographics — write raw AntV syntax for full control.
Create a Diagram slide
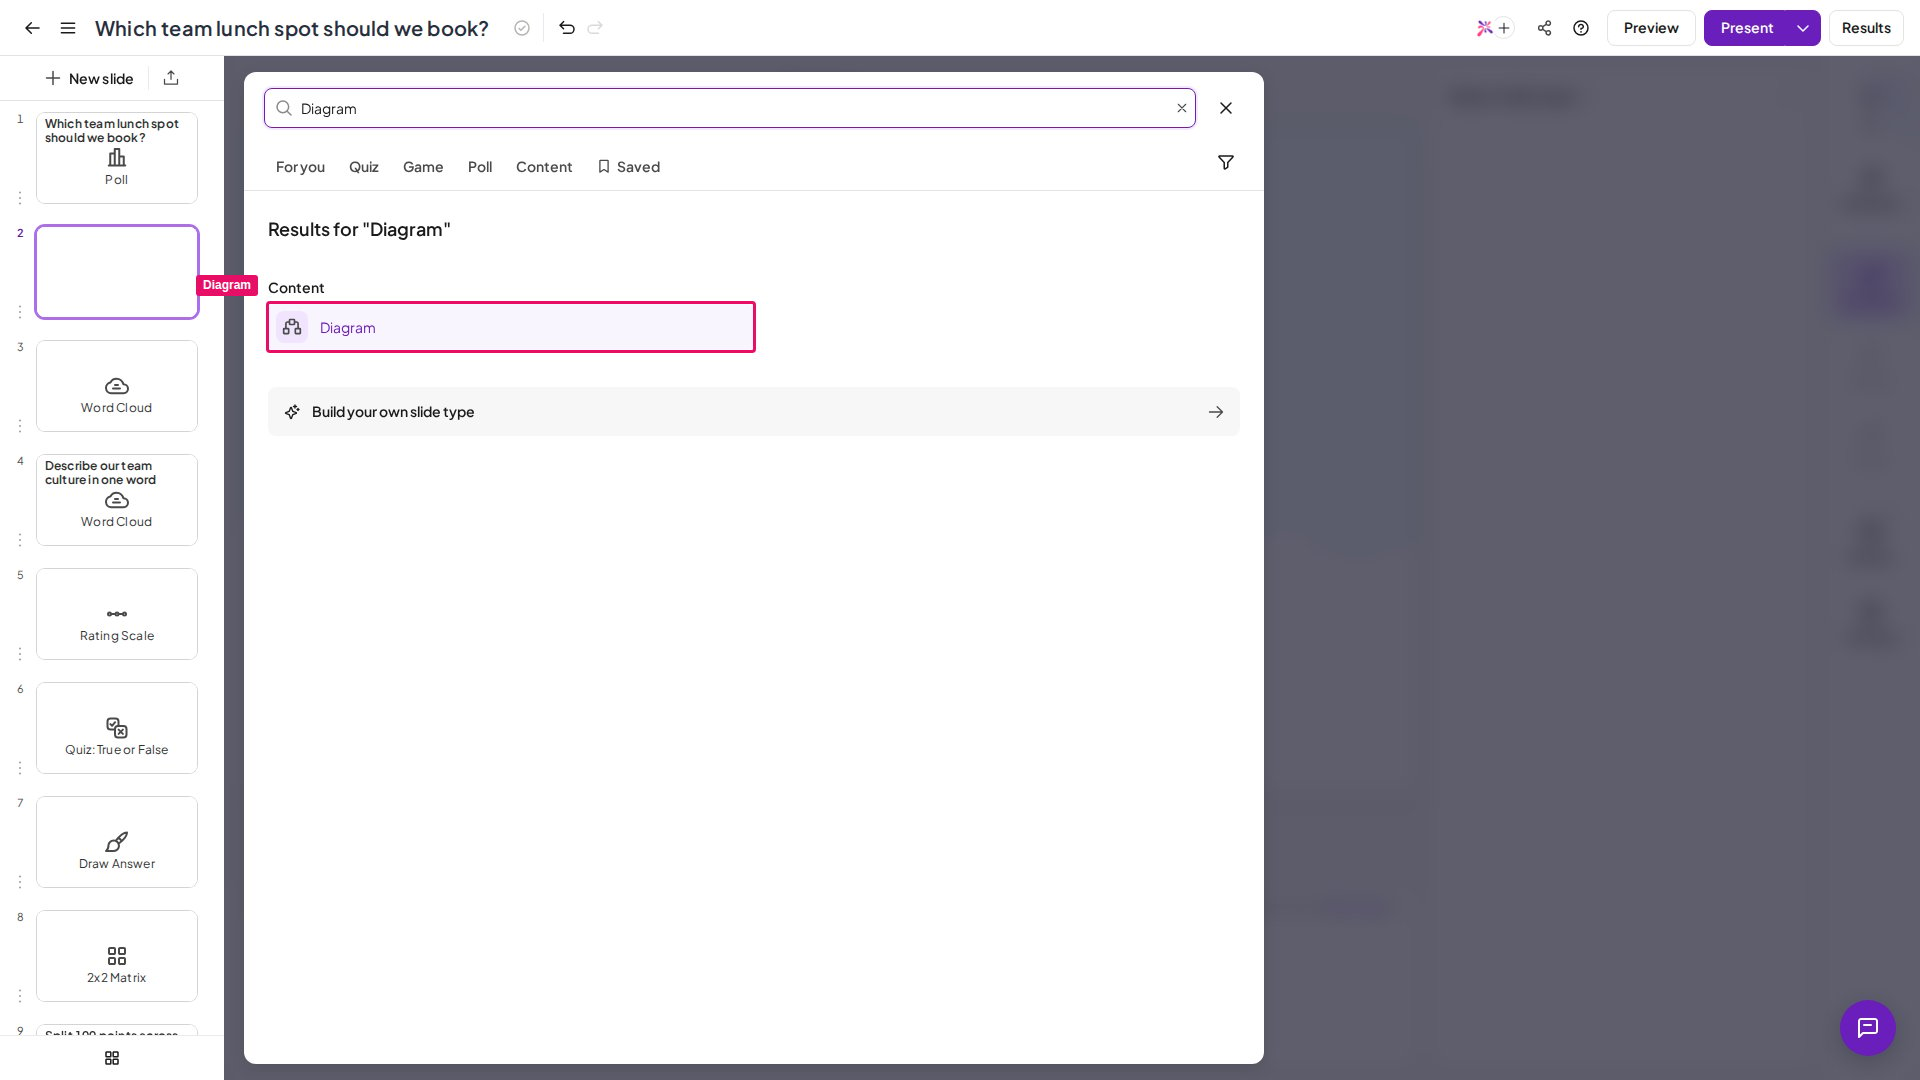
1
Add the slide
In the editor, click New slide and select Diagram from the Content tab of the slide type picker.
2
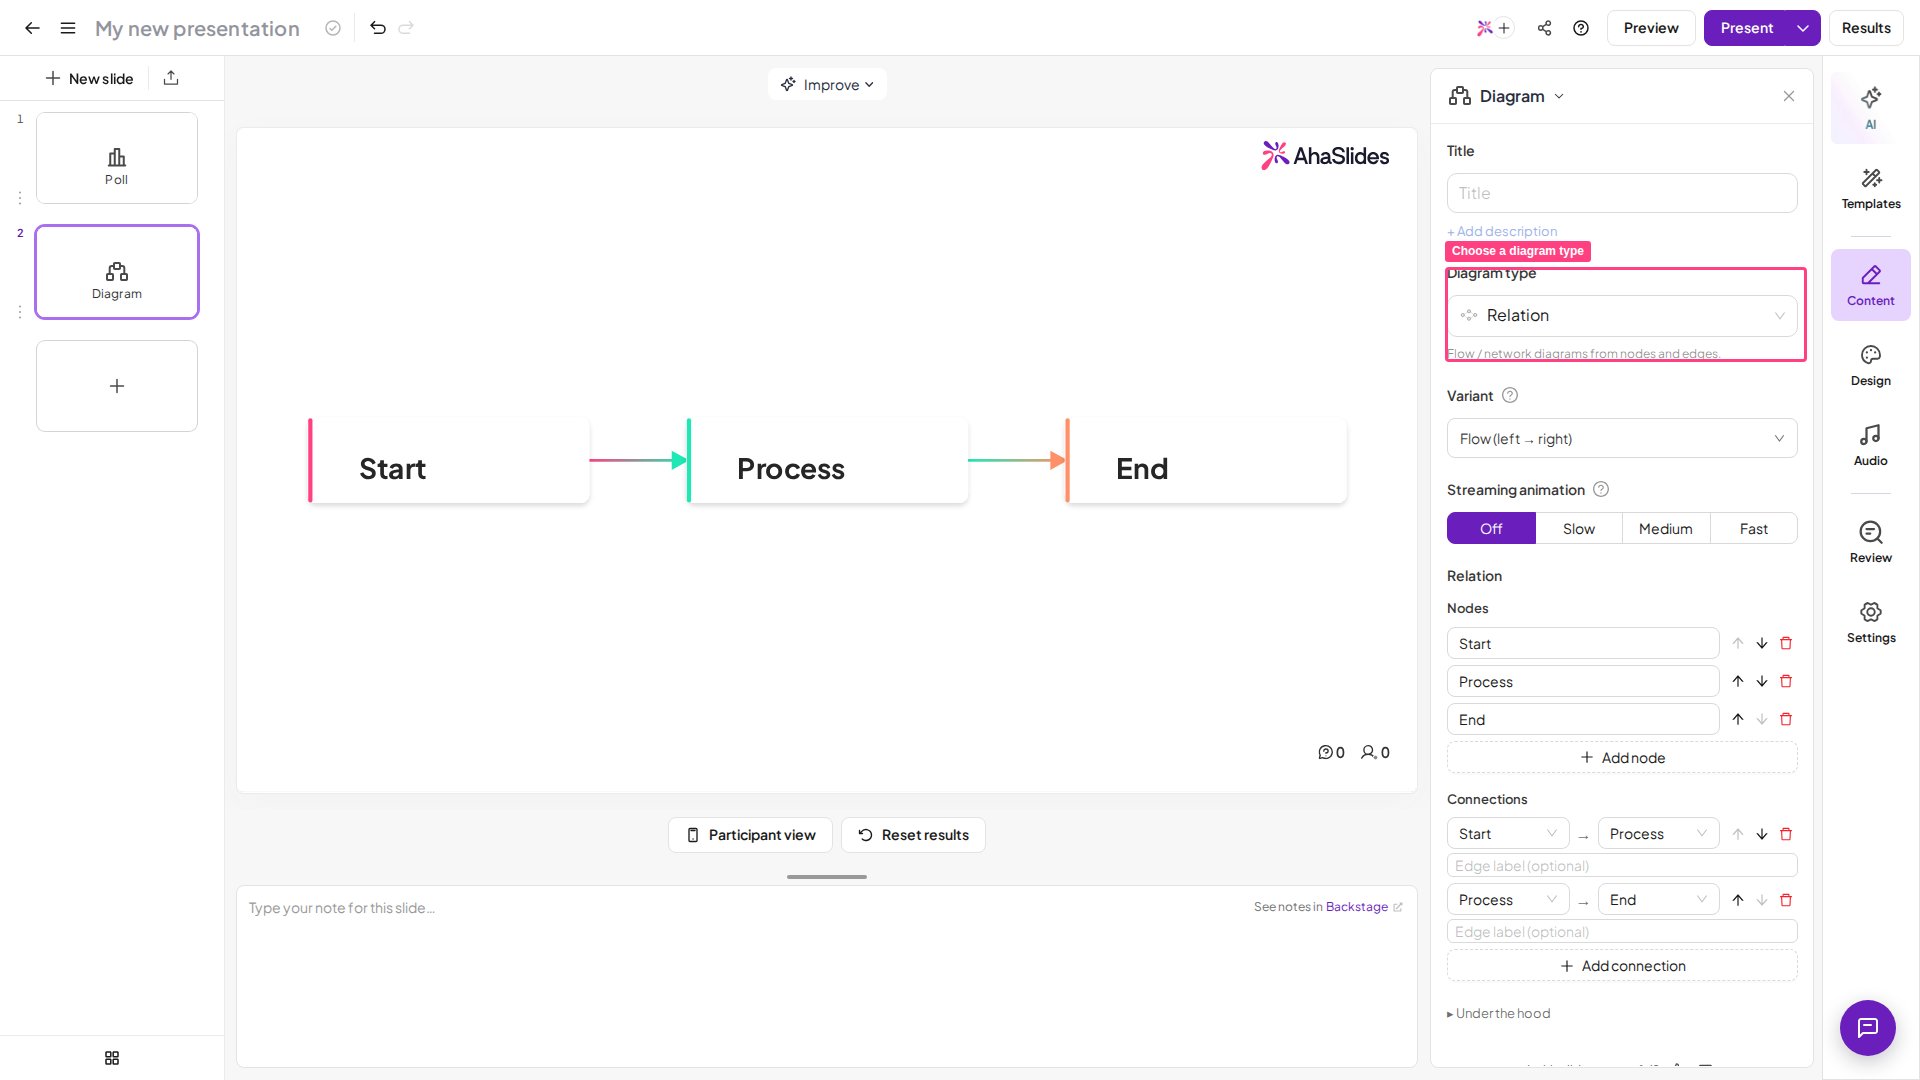
Choose a diagram type
In the right panel, open the Diagram type dropdown and choose the type that fits your content. The canvas previews the diagram as you switch types.
3
Choose a variant
Open the Variant dropdown to choose how the diagram is laid out visually. Visual previews appear in the dropdown to help you pick.
4
Fill in your content
Depending on the type: add nodes and connections (Relation), nest child nodes under a root (Hierarchy), add items with labels and descriptions (Items), add data points with labels and values (Chart), add words with weights (Word Cloud), add groups and their items (Compare), or type AntV syntax directly (Advanced).
5
Set streaming animation (optional)
Use the Streaming animation control to animate the diagram when the slide first appears. Options are Off (default), Slow, Medium, and Fast.
6
Add a title (optional)
Type a title in the Title field at the top of the right panel, with an optional short description underneath.
The Diagram slide is not currently supported by the AhaSlides MCP
create_slides() tool. Add Diagram slides manually in the editor.Present a Diagram slide
When you reach a Diagram slide during a presentation, the diagram fills the slide area on the presenter screen. Participants viewing on their devices see the same visual in a read-only format — there is no response or interaction required from the audience on a Diagram slide. If streaming animation is enabled, the diagram animates in when the slide first appears.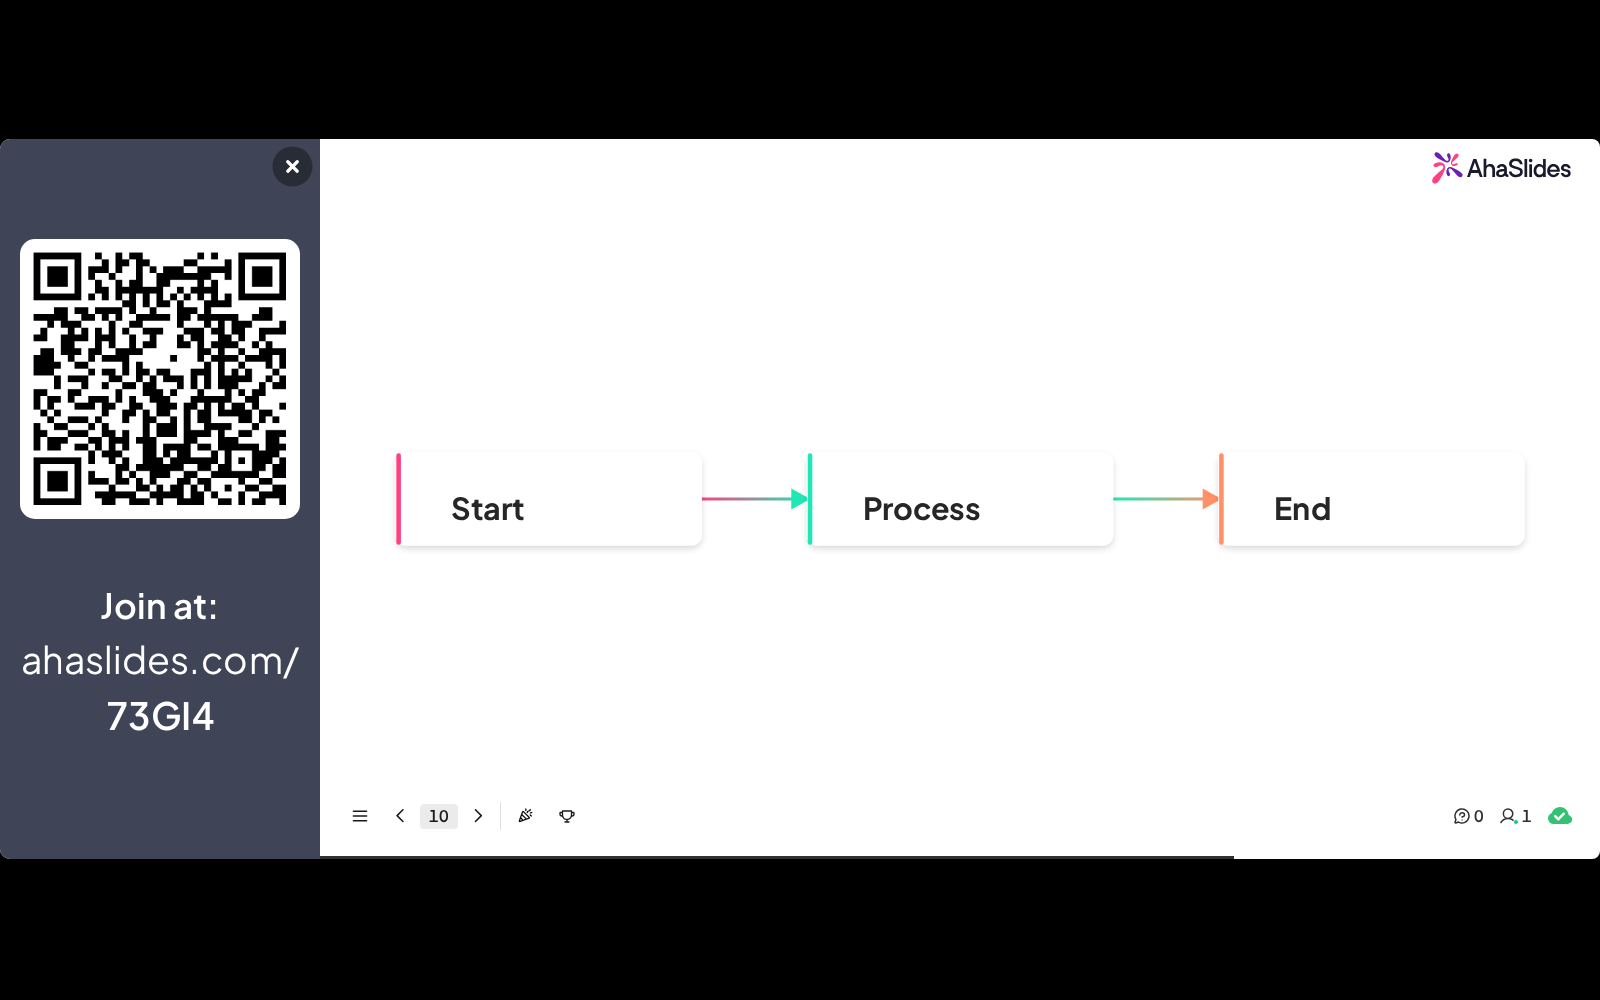
Diagram types and variants
The Word Cloud diagram type produces a static, weighted word cloud you configure yourself — it’s distinct from the interactive Word Cloud slide where participants submit live responses.
Diagram slide vs. Content slide
Have a question?
Contact our support team — if you’re logged in, use the chat bubble in the bottom-right of your dashboard; otherwise contact us here or email hi@ahaslides.com.
Want to connect with other users? Join the AhaSlides community to share tips, request features, and see how others engage their audiences.