

How the Split the Points slide works
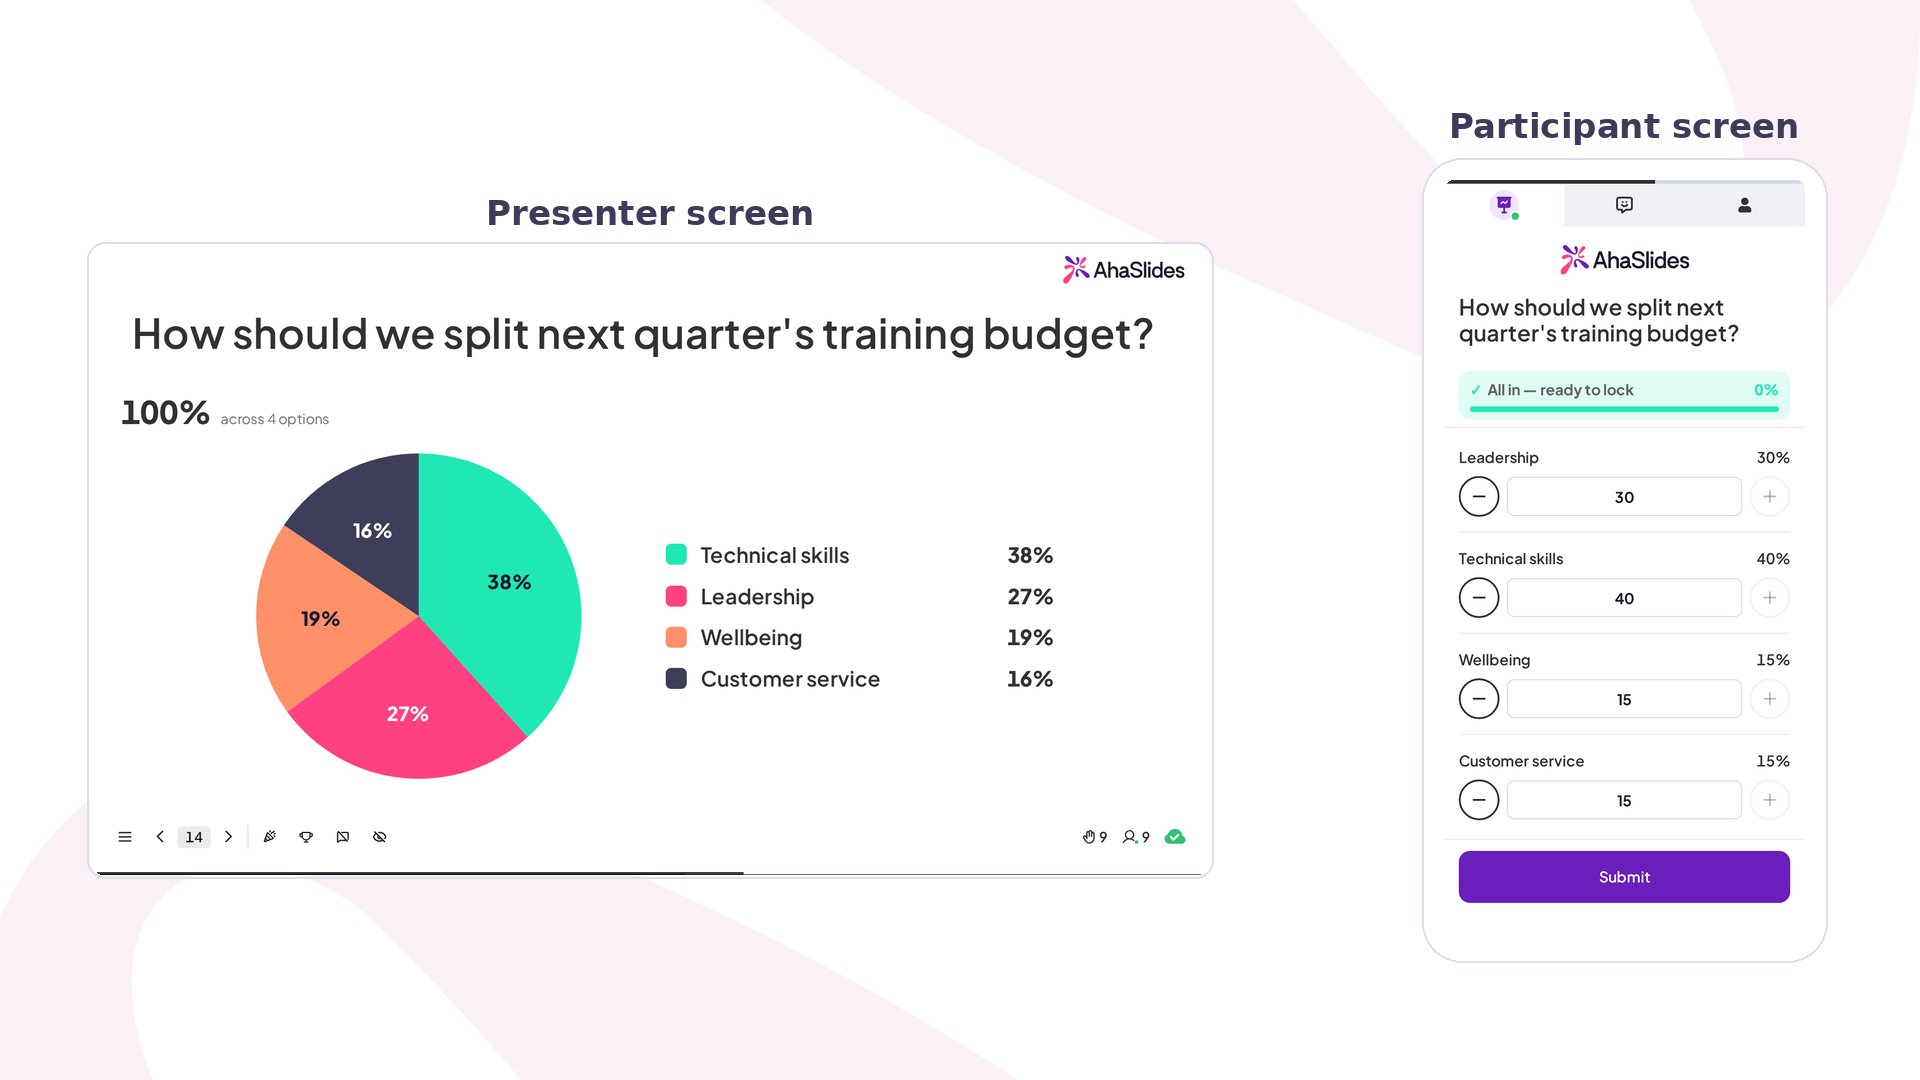
You write a question and list the options you want the room to weigh. You also set a total — the size of the pool each participant gets — and choose what that pool is measured in. On their phones, each participant divides the whole pool across your options using the minus and plus buttons (or by typing an exact amount) for each option, watching a running “left to place” tally as they go. Give an option more and you’re saying it matters more; a running total keeps everyone honest that the points have to add up. When they’re happy, they hit Submit. On your presenter screen the room’s answers aggregate live: each option shows the average share everyone gave it, rendered as a pie chart by default so the part-to-whole split reads at a glance. As more people submit, the picture settles toward the group’s consensus.Setting up your Split the Points slide
1
Add the slide
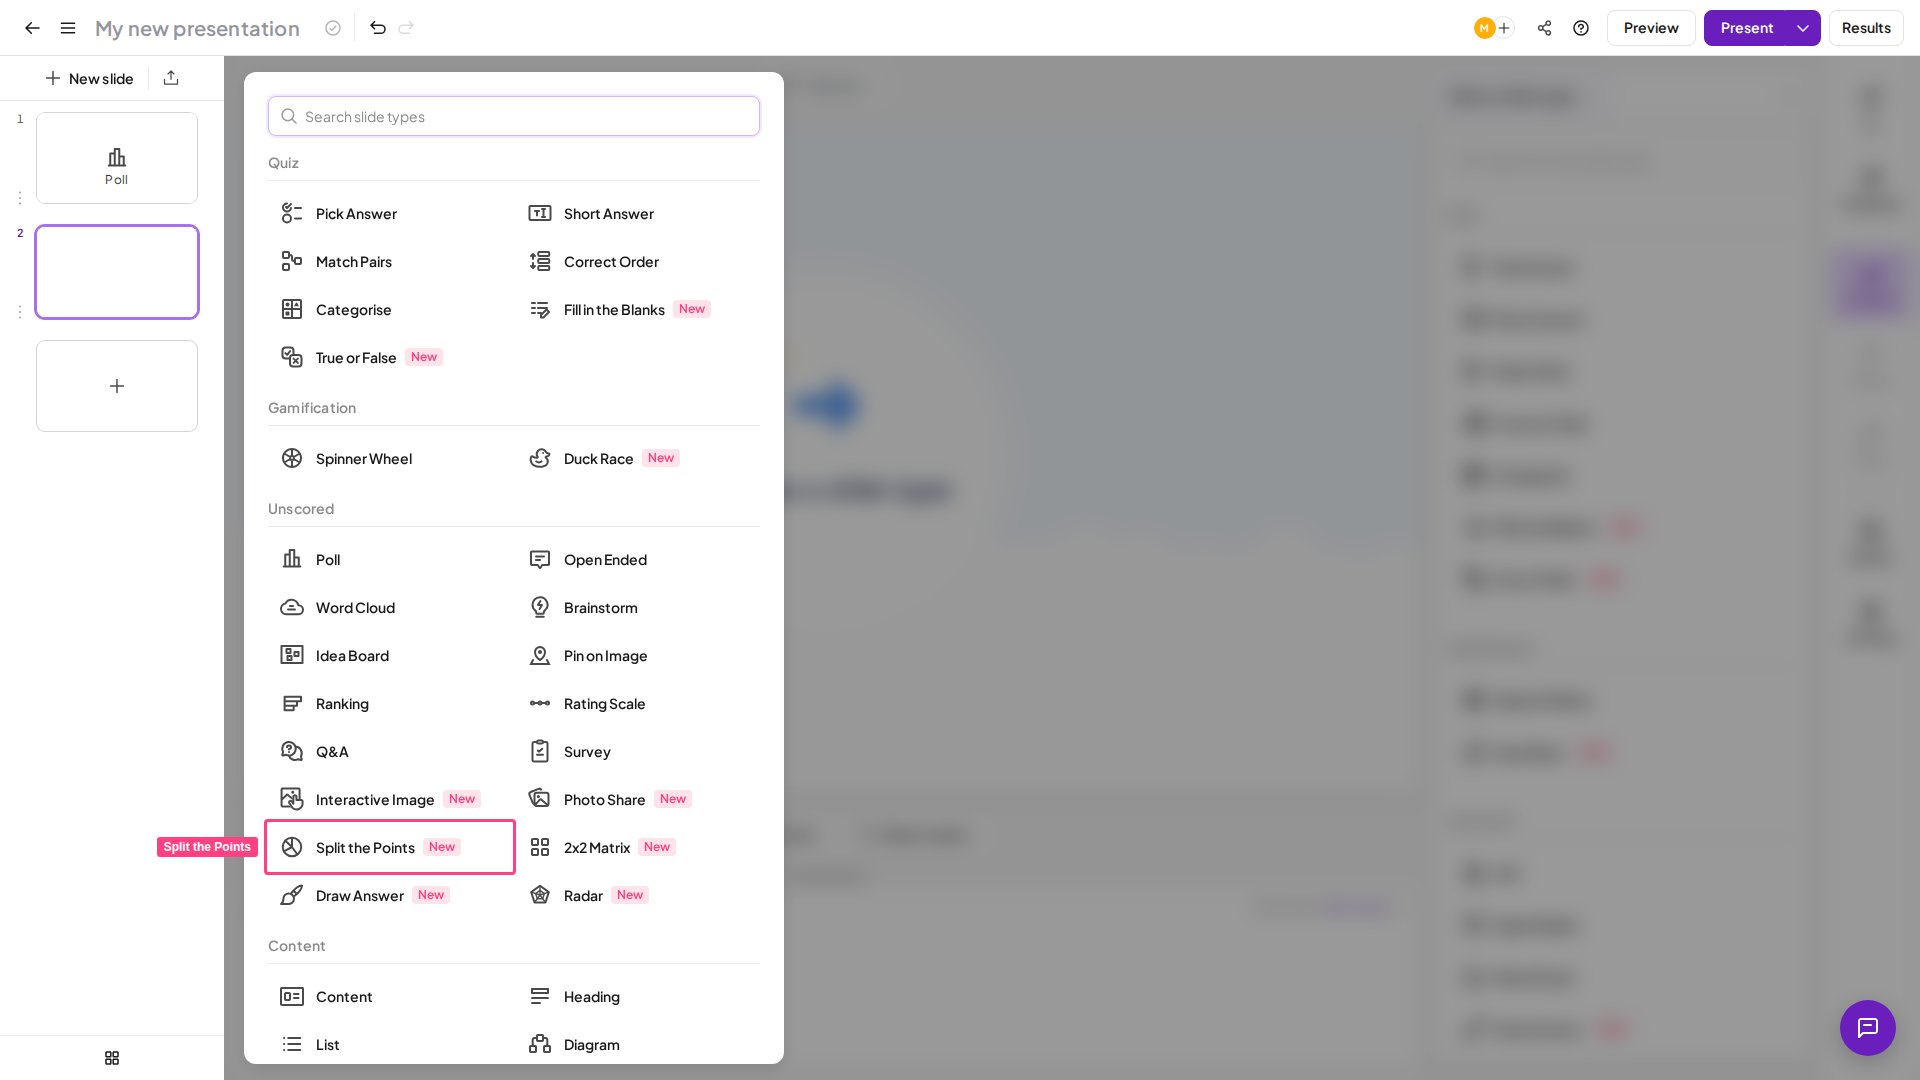
In the editor, click New slide and select Split the Points from the Vote section of the slide type picker.
2
Write your question
Click into the slide’s title field and type the prompt your audience will answer — for example, “How would you split next quarter’s budget?” or “Where should we focus first?”.
3
Set the pool and its unit
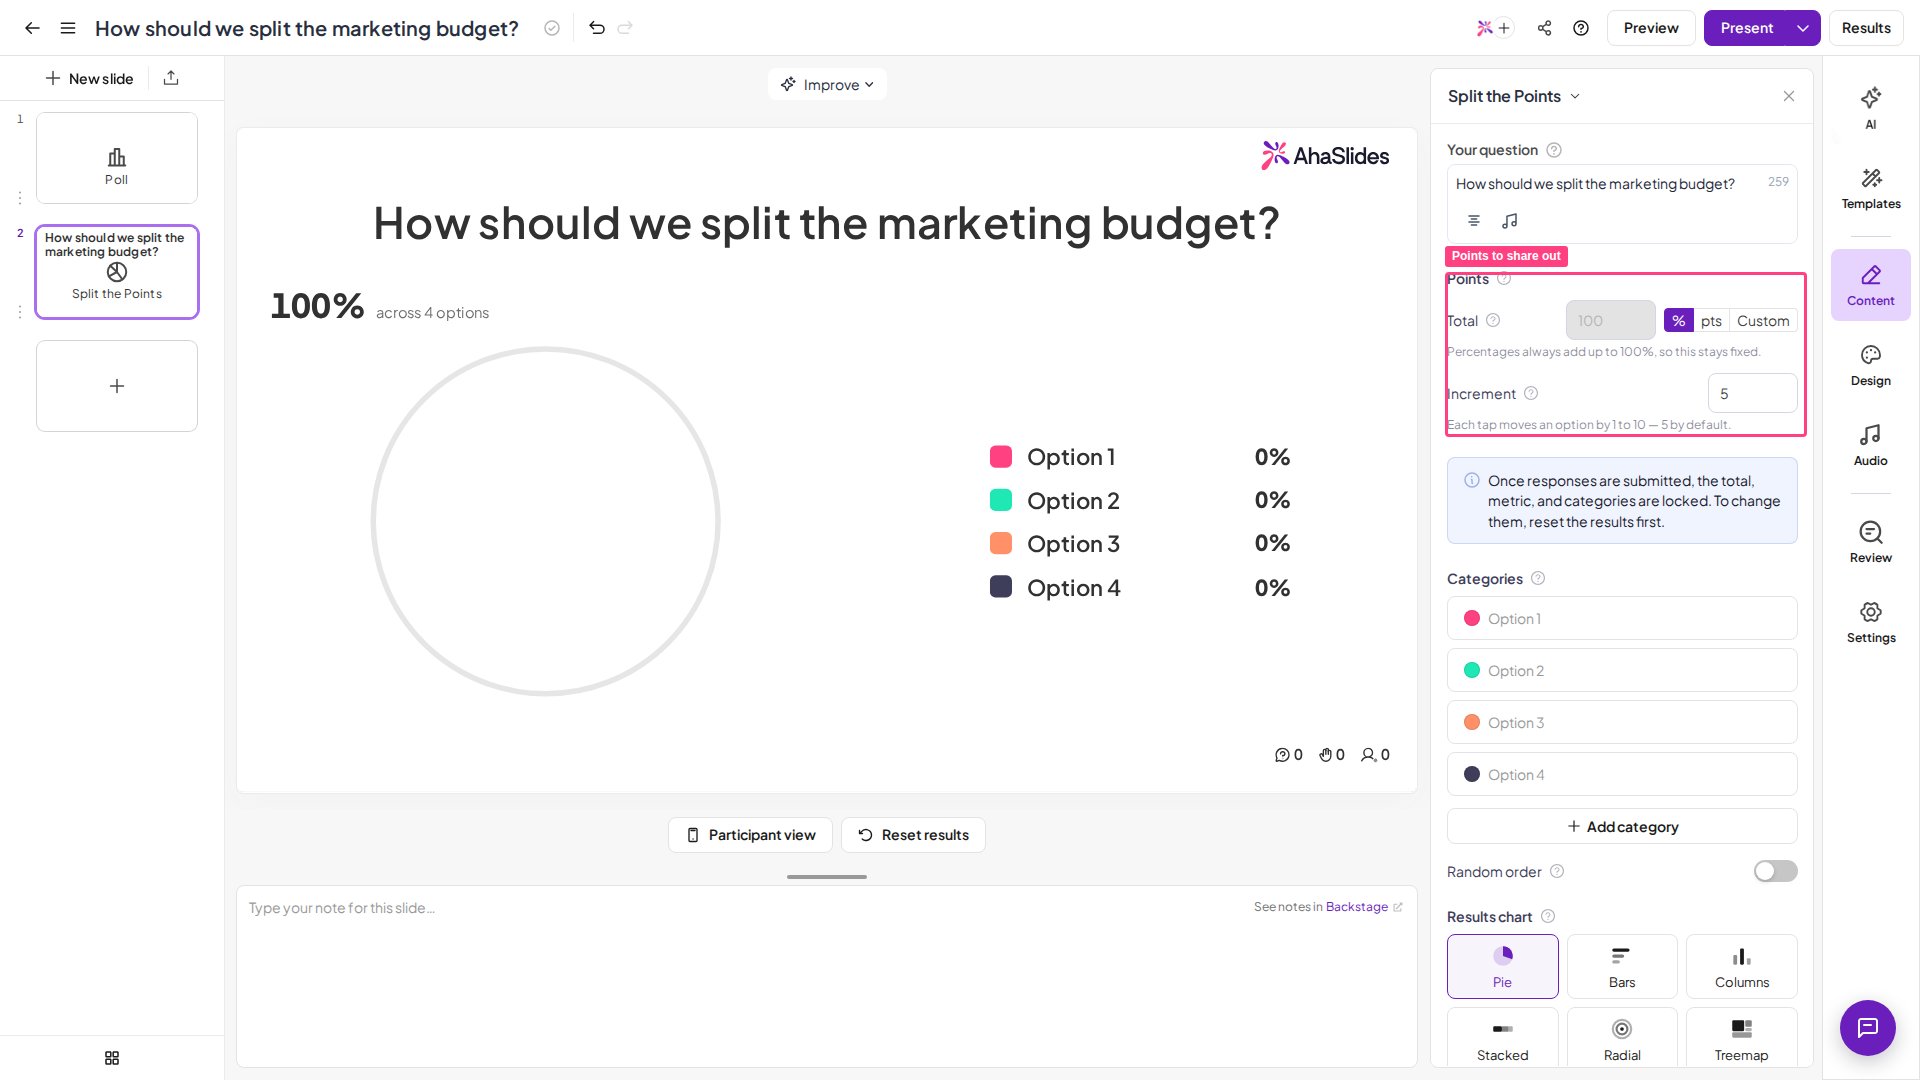
In the settings panel, the Points section controls the pool everyone divides. Set the Total (the pool size), the Increment (how much each tap of the minus or plus button moves an option), and the unit — %, pts, or Custom. With % the total is fixed at 100, since percentages always add up. With pts or Custom you can set any whole number from 10 to 10,000. Choosing Custom reveals a Metric field where you type your own label — credits, hours, €, stars, or anything else — which then shows next to every amount.
4
Add your options
Under Categories, list the options you want the room to split across — a minimum of 2 and up to 8, each up to 30 characters. Use Add category to add rows, drag to reorder, and turn on Random order if you’d like each participant to see the options in their own shuffled order so position can’t sway the split.
5
Choose how results display
Under Results chart, pick how the room’s split shows on your screen — Pie (the default), Bars, Columns, Stacked, Radial, or Treemap. Every type reads the same answers, so you can switch freely to whichever tells the story best.
Previewing and presenting
Click Preview in the top header to rehearse the slide before going live — no participants needed. You’ll see both the presenter results view and the participant allocation view on a phone screen. When you’re ready, click Present. Participants join at the access code shown on screen, and their splits populate your chart live as they submit.Audience experience
On their phones, participants see your question, your options, and the pool they have to divide. Each option gets minus and plus buttons with an amount field, and a running counter shows how much of the pool is still left to place. They tap the buttons or type an amount to weight the options, and once the whole pool is placed they’re prompted that everything is in and ready to lock. Participants can submit even with some of the pool left unplaced — a quick confirmation checks that’s what they meant before locking it in. After submitting, their split is stored, and the live results build on your presenter screen.Common use cases
Split the Points earns its place whenever a limited resource has to be shared out, or when you want relative weight rather than a single pick.Product and Business Teams
Split a fixed budget across competing initiatives and the room’s real priorities surface as proportions, not just a ranked list. It’s the fast way to run a lightweight prioritization exercise live.
Trainers and Workshops
Hand out 100 points and ask the group to divide them across values, goals, or focus areas. The spread starts the conversation — where people disagree is exactly what’s worth discussing.
Teams and Meetings
Allocate effort, headcount, or time across projects to make trade-offs explicit. Because the pool is fixed, the room can’t say “everything is important” — they have to choose.
Teachers and Lecturers
Have students distribute a set of points to show how they weigh factors in a decision, then compare the class’s averages to spark debate.
Fun and Team Building
Split a made-up budget across office perks, team-trip ideas, or snacks. Watching where the points land — and where they don’t — is half the fun.
Strategy and Planning
Weight risks, opportunities, or criteria against each other so the group sees the whole picture in one chart instead of arguing them one at a time.
What Split the Points is not
- Not a scored quiz — there’s no correct split and no points awarded to participants; the “points” are what they distribute, not what they earn.
- Not a single-choice vote — if you just want the room to pick one option, a poll is simpler. Split the Points is for weighting several options at once.
- Not a strict ranking — if you want an ordered list rather than proportional shares, reach for the Ranking slide instead.
When not to use it
Choose a different slide type when:- You only need one dimension weighed or a single winner — a poll or rating scale is quicker.
- You want the room to weigh options on two scales at once — the 2×2 Matrix plots two dimensions together.
- The answer needs to be open text or a free response rather than a division of a fixed pool.
Frequently asked questions
How many options can I add?
How many options can I add?
Between 2 and 8 options, each up to 30 characters. Every participant divides the same pool across all of them.
Can I use something other than points or percentages?
Can I use something other than points or percentages?
Yes. Set the unit to Custom and a Metric field appears where you type your own label — credits, hours, €, stars, or any unit you like. That label then shows next to every amount on screen.
Does the total have to be 100?
Does the total have to be 100?
Only when the unit is %, where the pool is fixed at 100 so the percentages add up. With pts or Custom you can set any whole number from 10 to 10,000.
Can participants change their answer after submitting?
Can participants change their answer after submitting?
Each participant divides the pool once and submits. If you need to re-run the exercise, reset the slide’s data to reopen it for a fresh round.
Do participants have to place every point?
Do participants have to place every point?
No — they can submit with some of the pool left unplaced. A quick confirmation checks that’s intentional before locking their answer in.
How are the results shown?
How are the results shown?
As a live Pie chart by default, with Bars, Columns, Stacked, Radial, and Treemap also available under Results chart. Every view reads the same averaged answers, so you can switch to whichever is clearest.